six system portfolio(rev 01) for es daytrading
The original Six portfolio has been revised with more emphasis on counter trend trades and somewhat lower trading frequency.
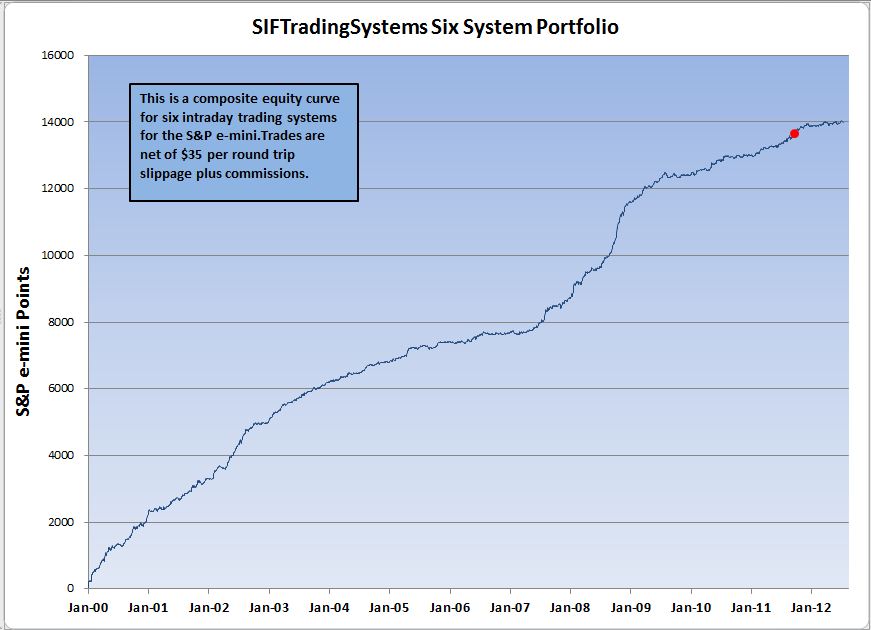
The results here are based on trading costs of $10.00 per round trip for commissions. Trades are all market orders with slippage assumed to be $25.00 per round trip.
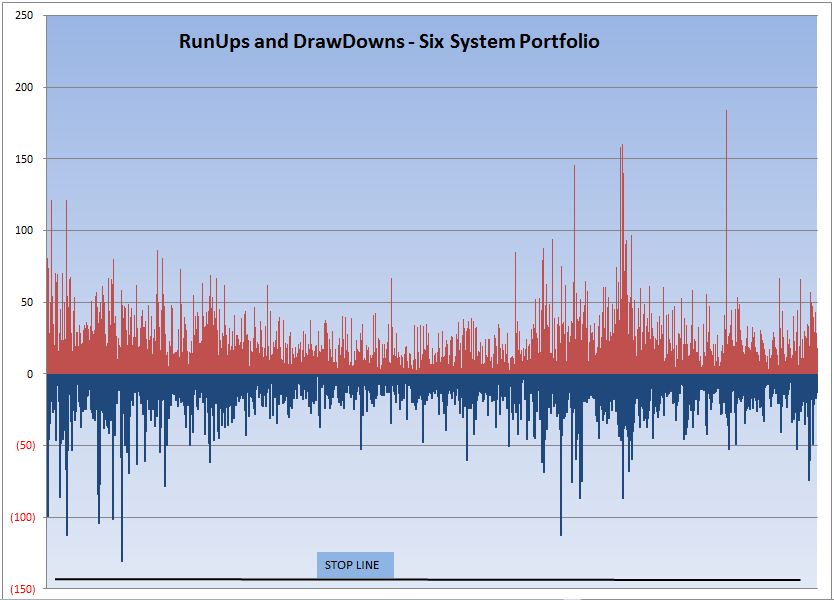
Stops: The intraday stop for this system is 150 points combined. It was set just outside the range of the largest intraday drawdown. Here is a picture.
12.11.2011: This system was given another component; not a new strategy, just adding in a part of an existing strategy which had previously been left out.
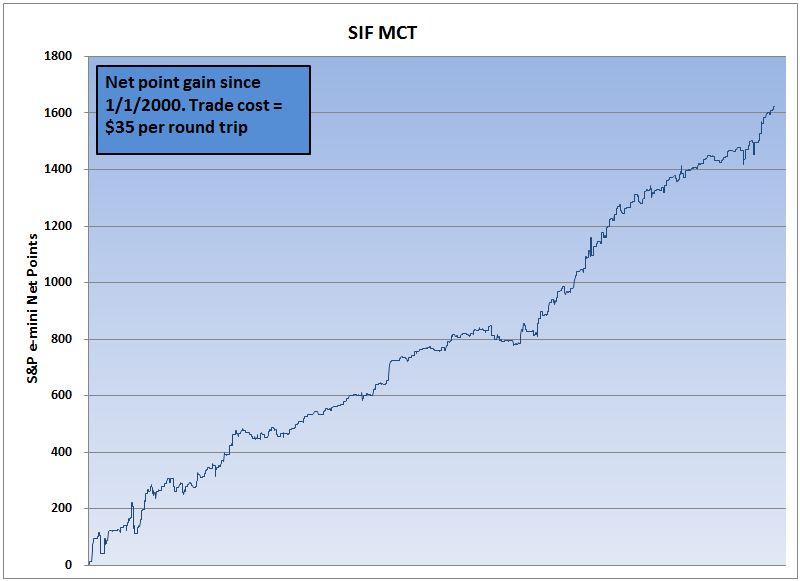
12.19.2011 Someone asked if the CTT system is part of this portfolio. It is not. The last system I put in is called SIF MCCT, which is another counter system. Here is an XL chart of it's equity curve.
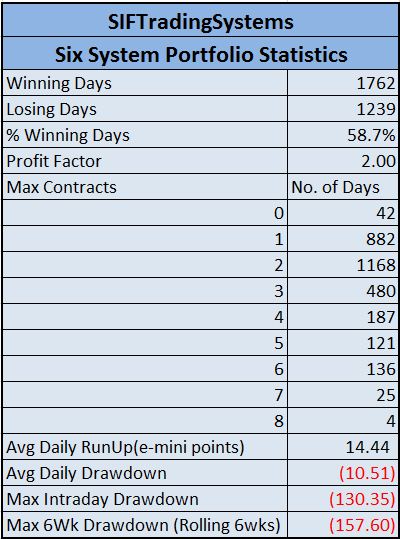
01.19.2012 The max contracts for this portfolio was incorrectly shown in the previous table as 7 instead of 8. This was due to an oversight and is not a change in the systems. For the 4 days in question, the average gain was over 33 points. The last occurrence of this was on 06.16.2011.
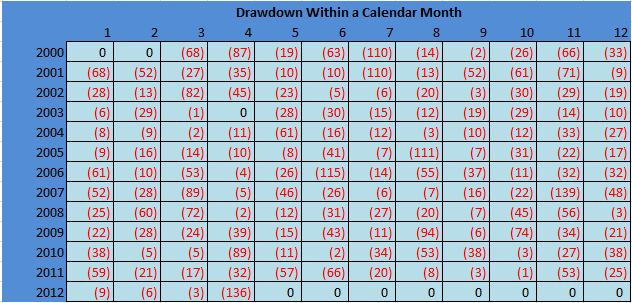
03.14.2012 There was a discrepancy between the drawdown shown in the monthly net table and the one in the statistics table on this page. Part of the reason for this is that the monthly drawdown is on a calendar month basis and the other was on a rolling time period which was slightly longer than a month. The data has been updated and the difference in the drawdown reflects the rolling vs calendar month. There have only been minor changes during this period which would not have caused any significant change in the backtest.
04.19.2012: This system has experienced in unusually deep drawdown. To see how it compares with all other months in the back test, click on the link below. These figures are for the drawdown inside a calendar month so they will be less than the maximum all time drawdown, which is about 160 points. The month is not over, so this could exceed anything we've seen. There is no way to predict what will happen, but so far the system has had 7 good months and one bad one.
Current Month Equity Trend (flash chart)
20 Week Equity Trend (flash chart)
20 Month Equity Trend (flash chart)
Out of sample performance (flash chart)(new 02.12.2012)
Subscribe (Note: Lot size is per system, so a ten lot trader could have up to 80 contracts open at once)
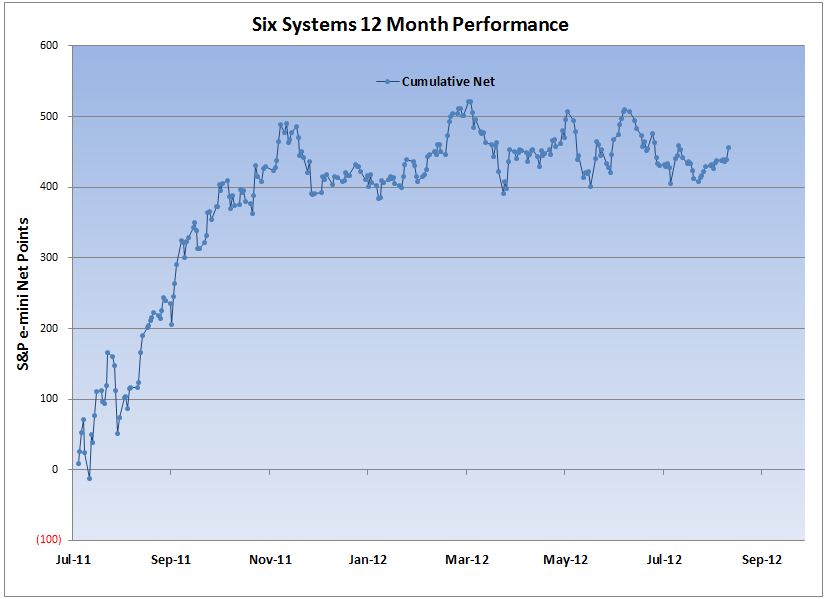
XL chart of 12 month equity curve
XL File with TradeStation Output (download)(updated 08.06.2012)
Monthly Net Points (For most current information check the 20 mo. flash chart).
Trade History (csv file- right click - save as)
